
My client asked for data to be presented in a virtual magazine format for a client. I was able to help the company think of new and innovative ways to showcase data outside of the traditional Powerpoint presentation.
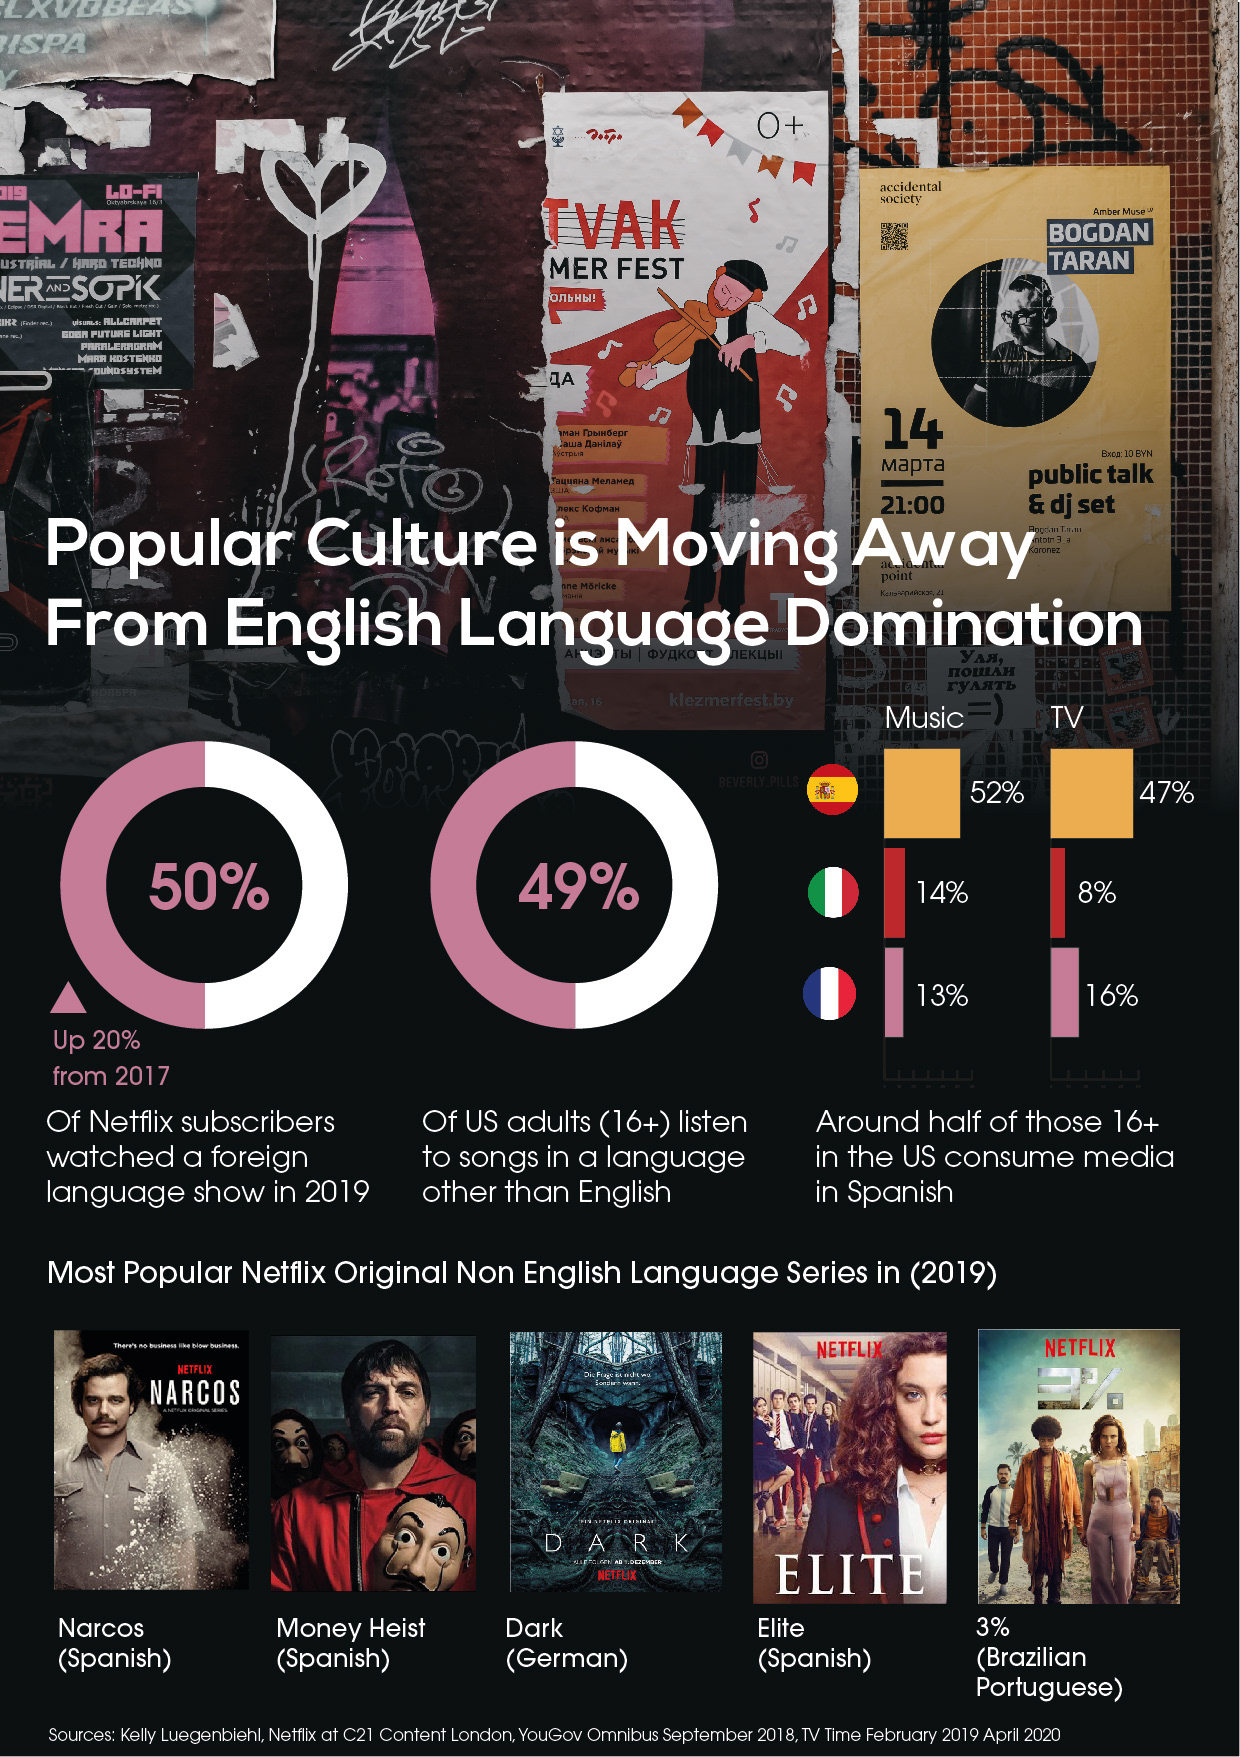
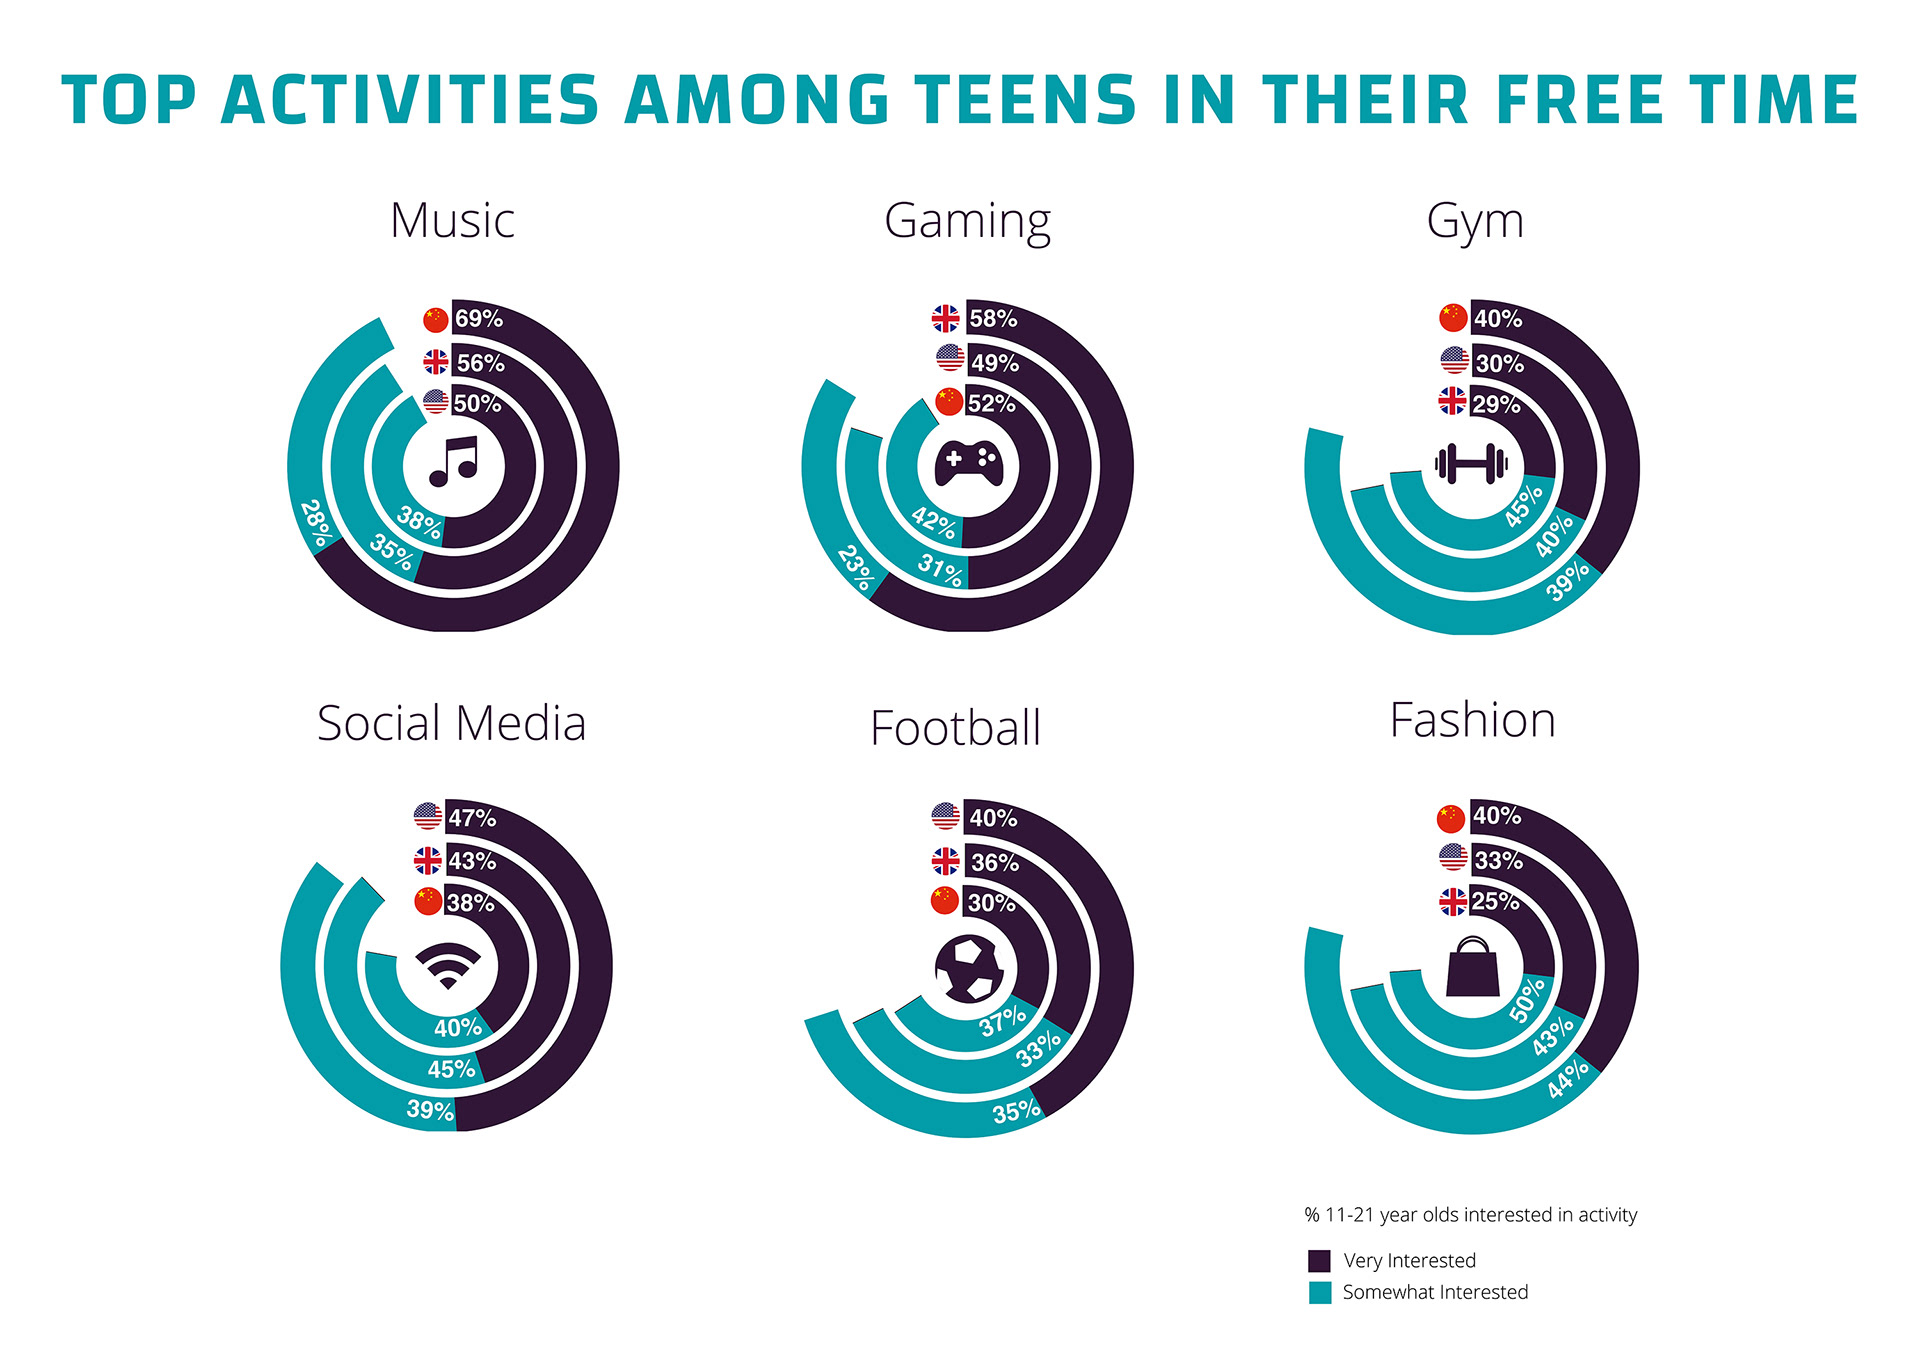
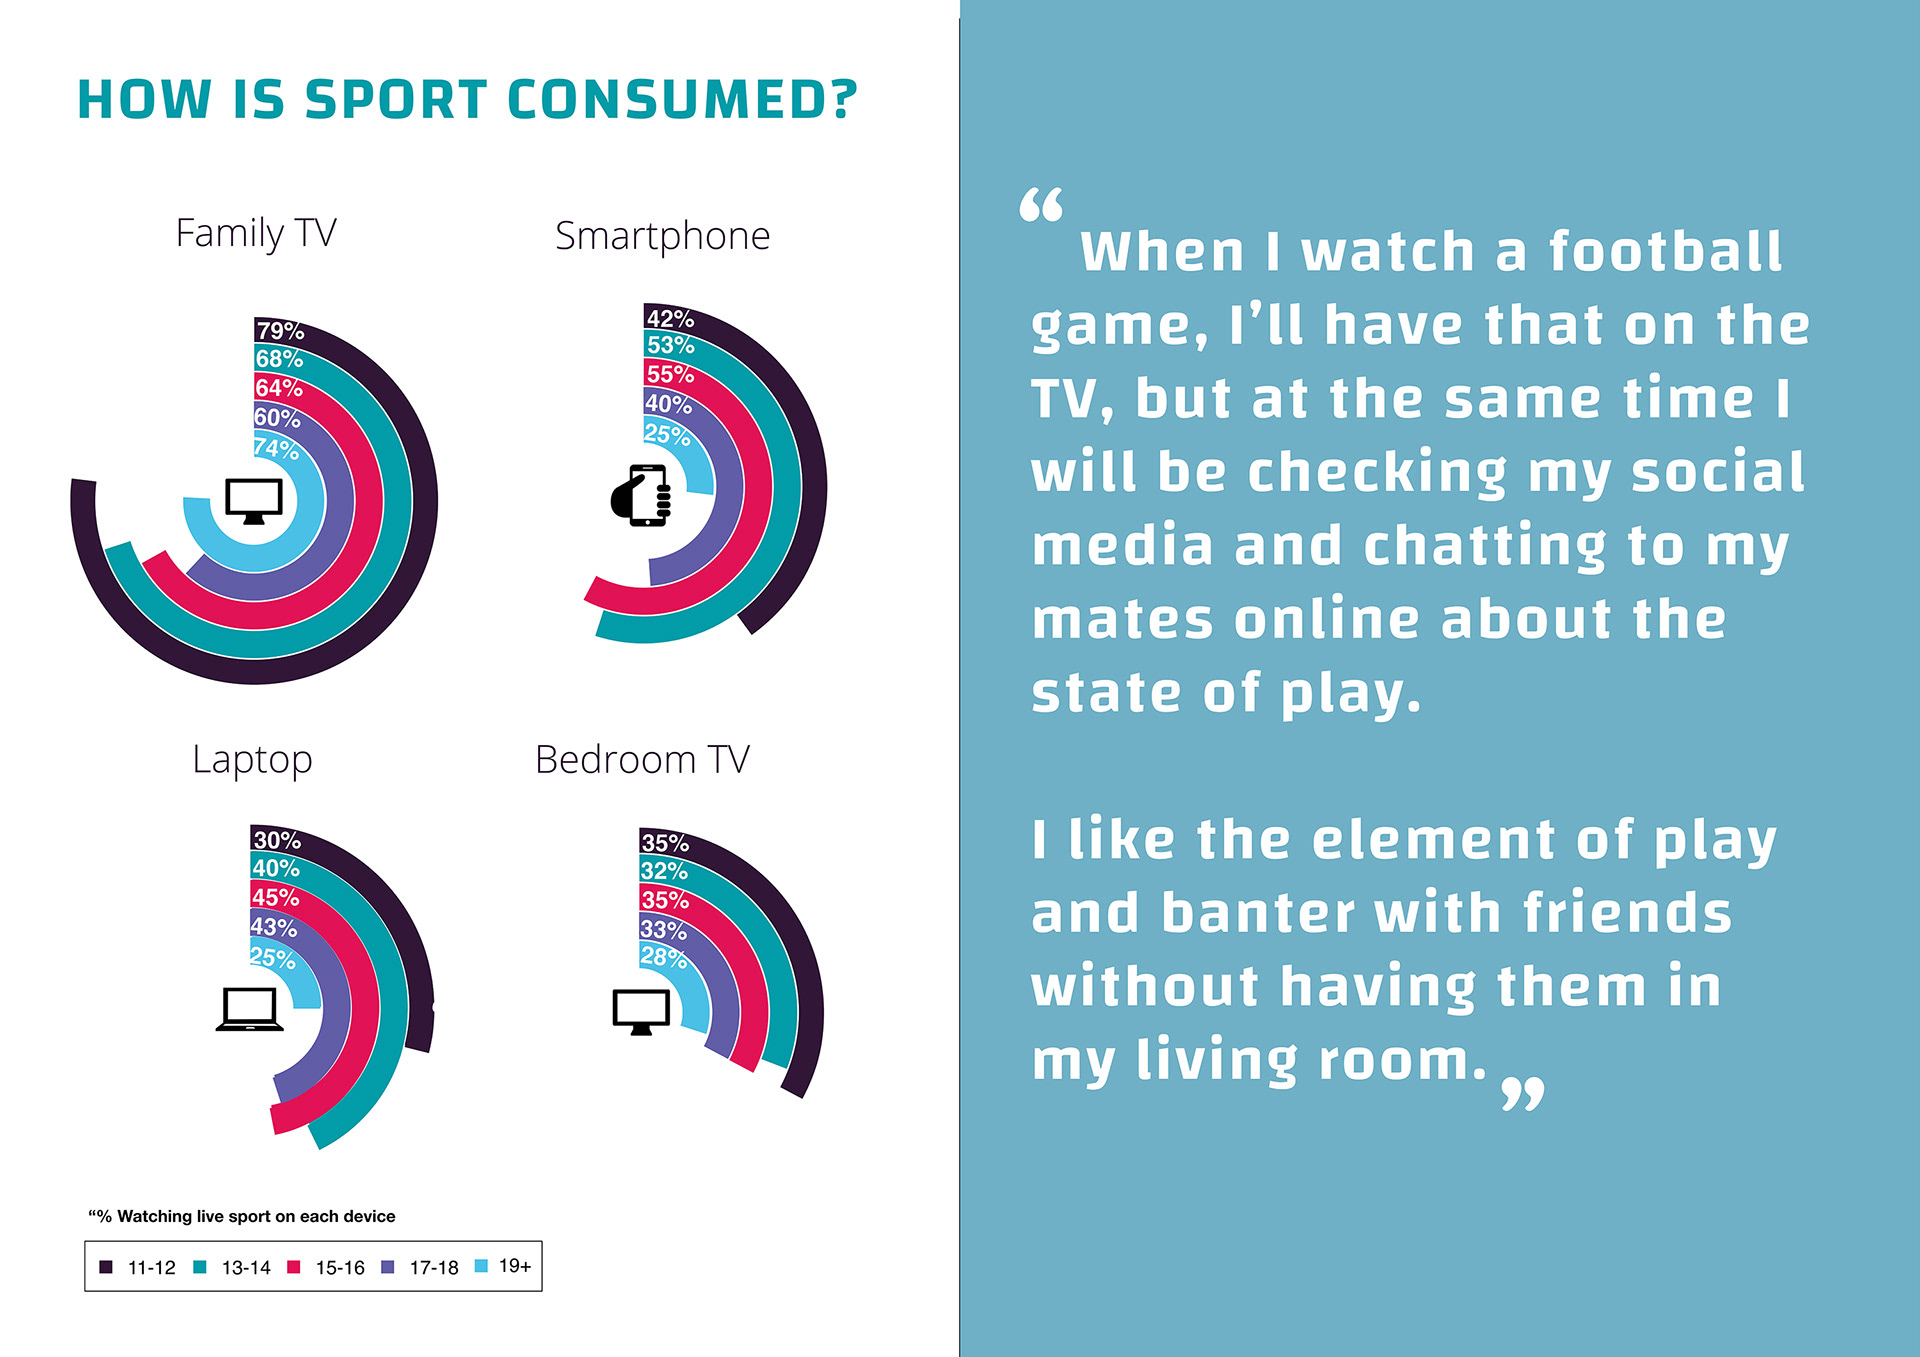
I created an infographic that could be used alongside editorial copy to tell a story comparing the different behaviours of subgroups and specific markets.
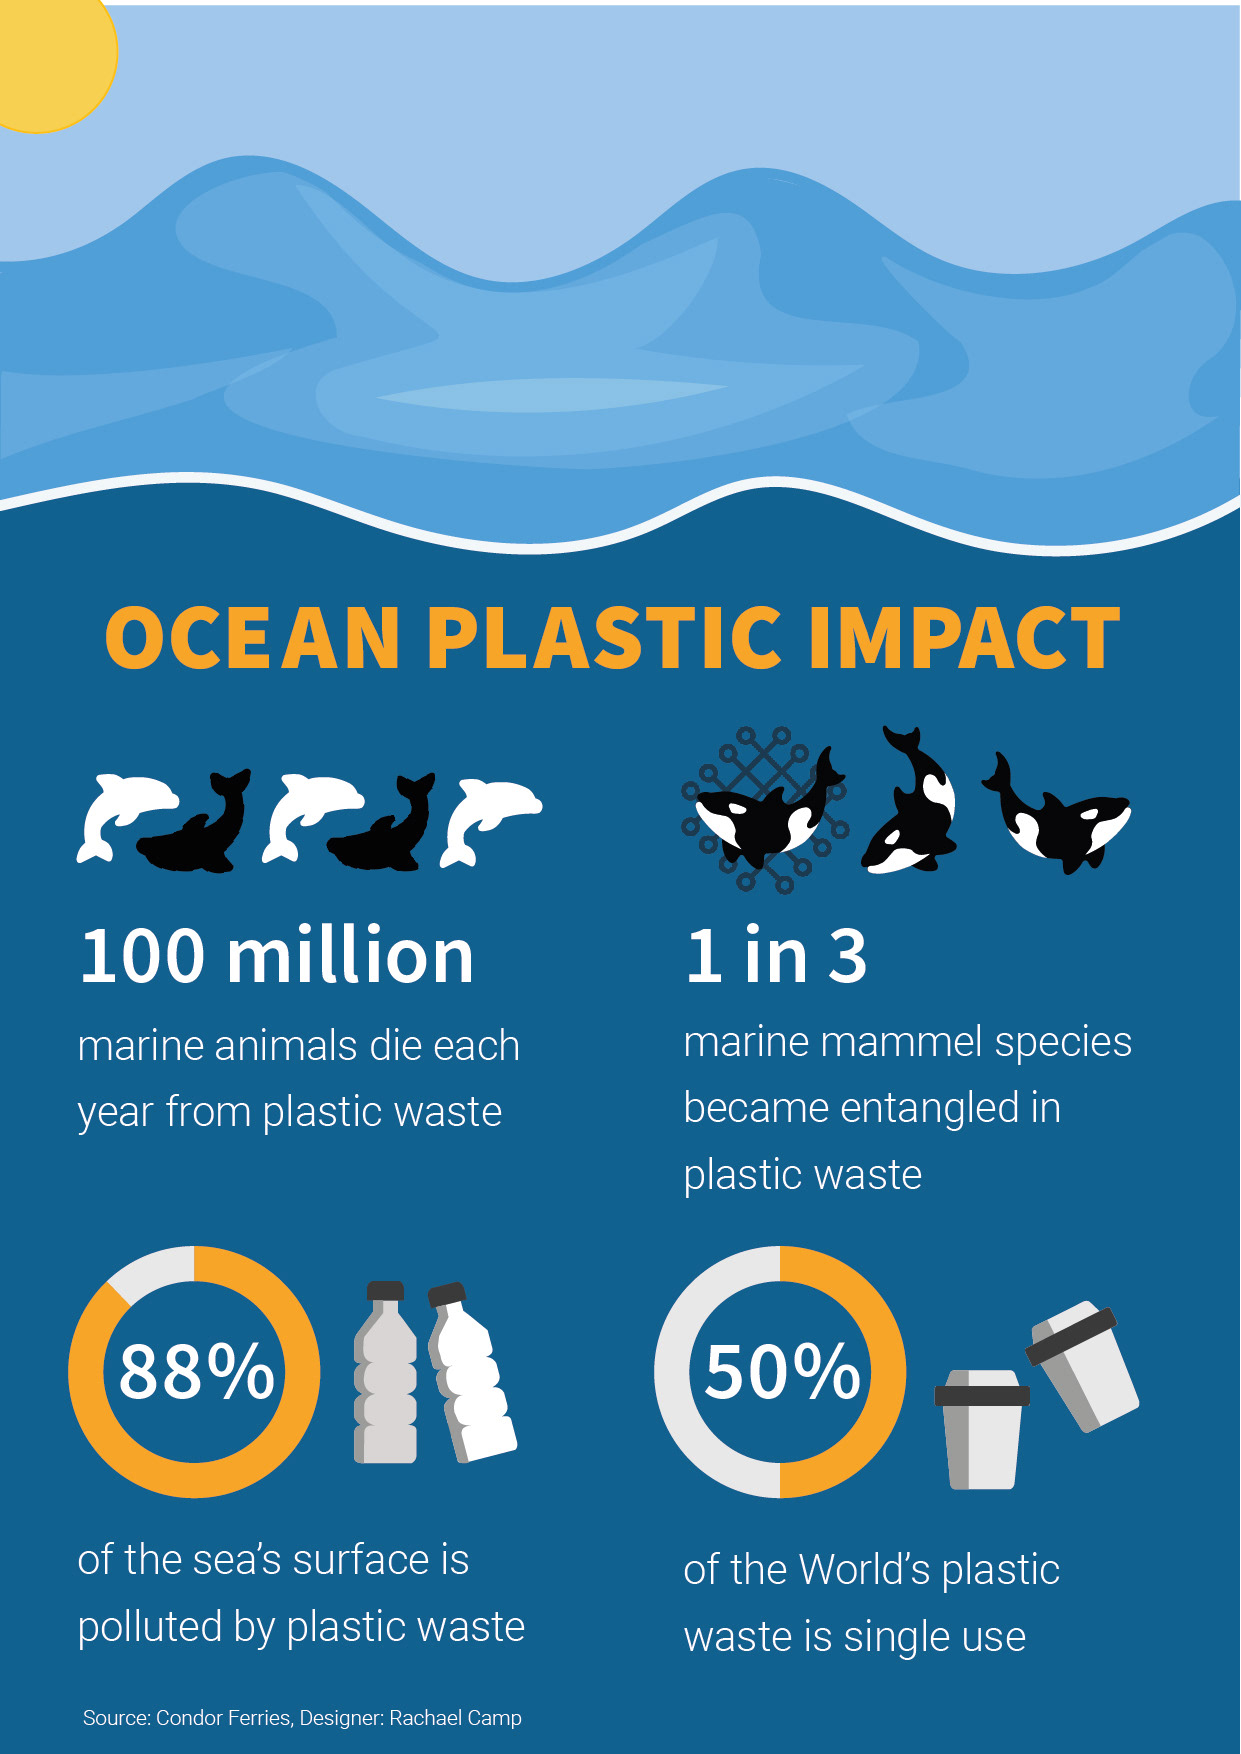
I also created a number of infographics for social media, using Adobe Illustrator, which consisted of telling short data stories with visual cues.